Data source
The data for this project were collected online by FiveThiryEight in late August, 2014. The researchers asked the survey takers whether or not they thought certain airplane behaviors were rude. The behaviors included are moving to an unsold seat, talking to a neighbor, reclining your seat, asking someone to switch seats to sit by friends, asking someone to switch seats to sit by family, waking up a neighbor to go to the bathroom, waking up a neighbor to walk around, bringing a baby, and bringing an unruly child. The researchers also inquired whether or not respondents had done these behaviors themselves. For all visualizations, people who responded that they had never traveled by plane before were excluded.
Participants
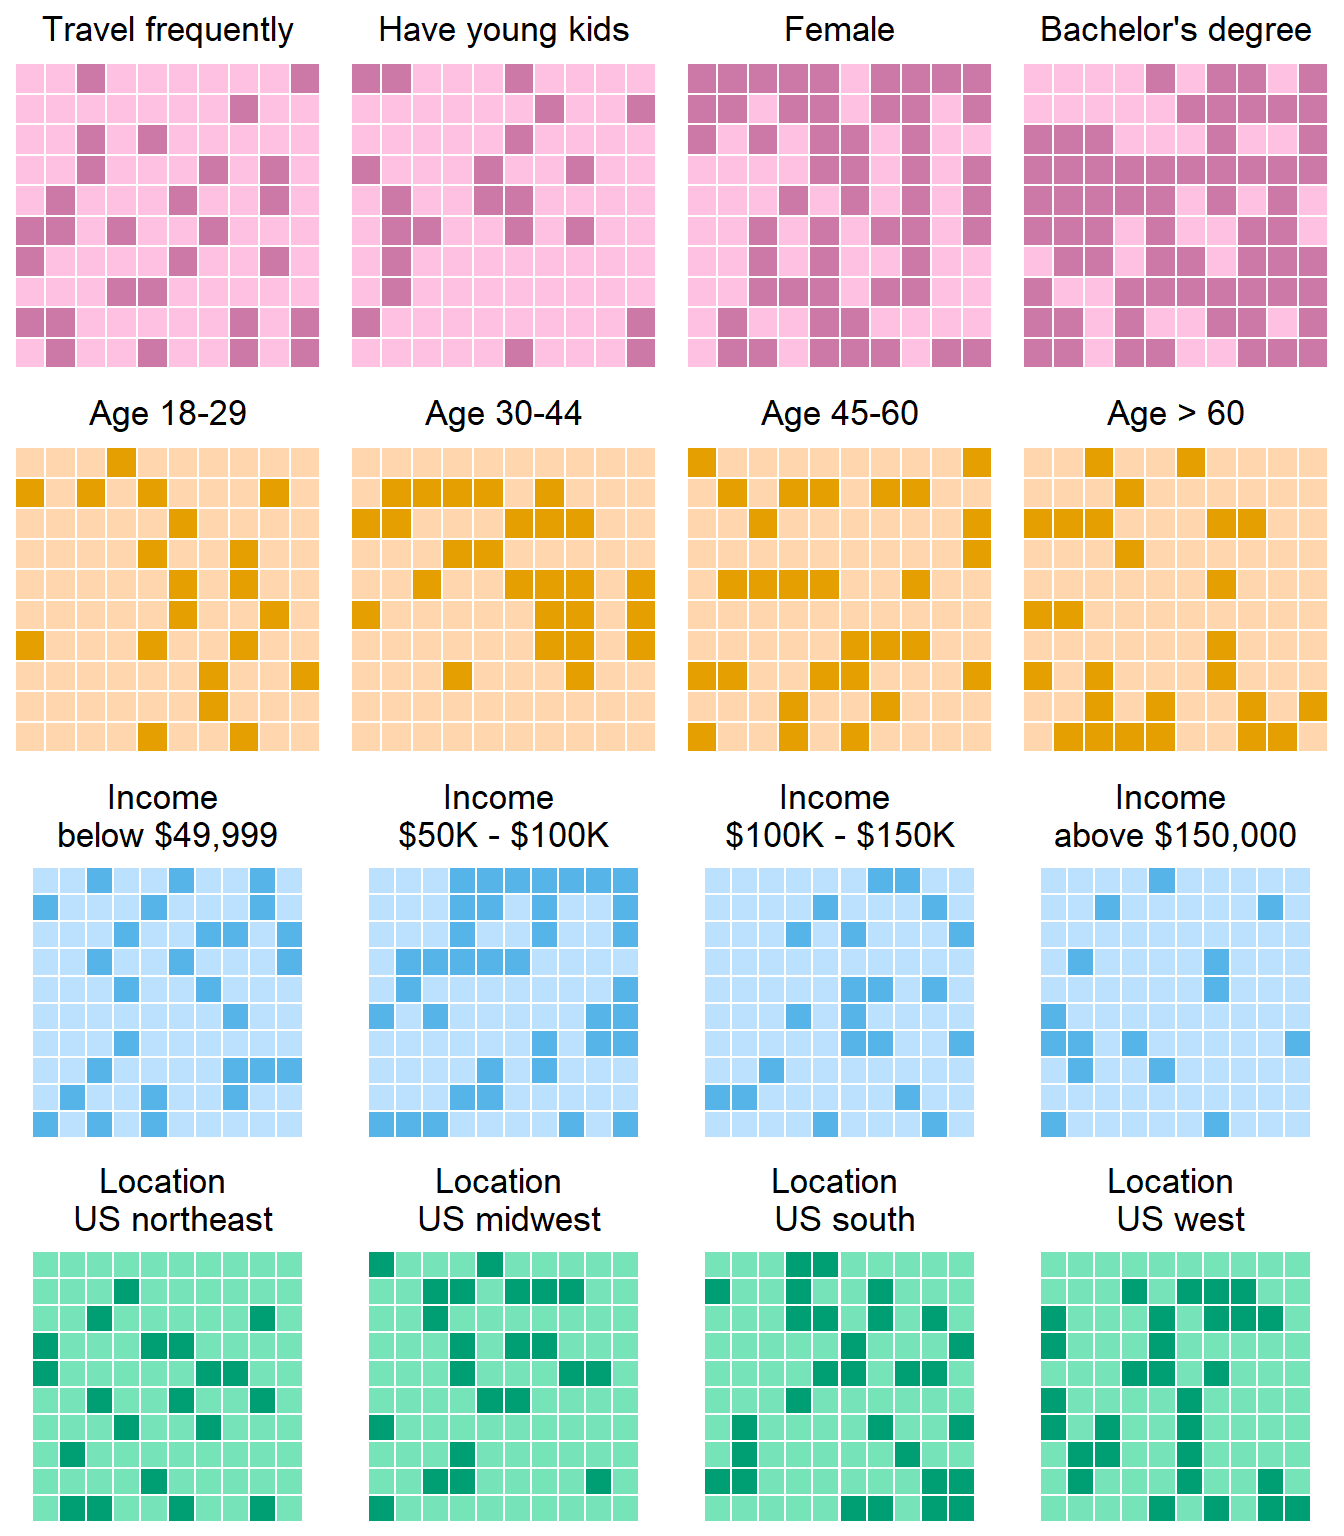
In each grid, there are 100 boxes. The darker shaded boxes represent the number of people out of 100 in the sample who fall under the title category. For example, about 28% of people in the sample noted that they travel frequently, so 28 boxes are shaded darker. This allows you to quickly take in information about the attributes of the participants in the sample.